Hier sind ein paar sehr interessante und witzige Fakten über Halloween in den USA:
U.S. Census Bureau Facts For Features: Halloween: Oct. 31, 2016
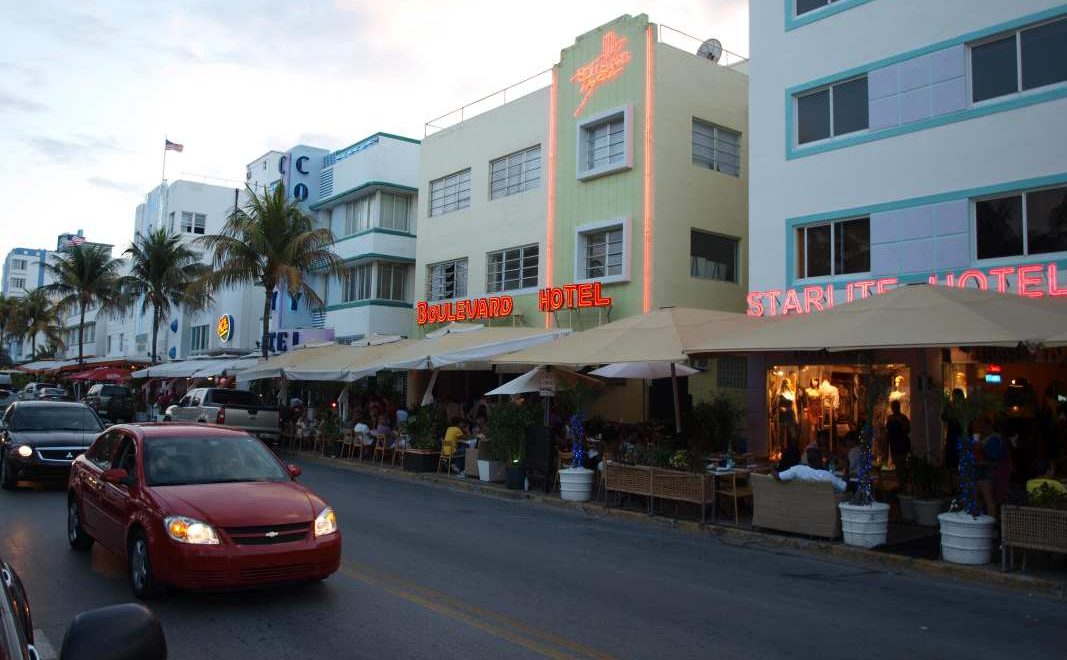
WASHINGTON, Oct. 28, 2016 /PRNewswire-USNewswire/ — Halloween, which dates back to Celtic rituals thousands of years ago, has long been associated with images of witches, ghosts and vampires. Today, Halloween has evolved into a celebration characterized by child-friendly activities, such as costumes, trick-or-treating and carving pumpkins into jack-o‘-lanterns.
Trick or Treat!
41.1 million
The estimated number of potential trick-or-treaters in 2015 — children ages 5 to 14 — across the U.S. Of course, many other children — older than age 15 and younger than age 5 — also go trick-or-treating.
Source: U.S. Census Bureau, 2015 Population Estimates, PEPASR6H
http://factfinder.census.gov/bkmk/table/1.0/en/PEP/2015/PEPASR6H?slice=year~est72015
118.3 million
The number of occupied housing units across the nation in the second quarter 2016 — all potential stops for trick-or-treaters.
Source: U.S. Census Bureau, Housing Vacancies and Homeownership, Table 8
www.census.gov/housing/hvs/data/histtabs.html
78.7%
The percentage of U.S. households that agreed their neighbors could be trusted in 2013.
Source: 2013 American Housing Survey
www.census.gov/newsroom/press-releases/2015/cb15-61.html
Hauntingly Delicious
37,128
The number of people employed by U.S. manufacturing establishments that produced chocolate and cocoa products in 2014. This industry’s value of shipments totaled $16.0 billion, up from $15.2 billion in 2013.
Sources: U.S. Census Bureau, 2014 Annual Survey of Manufactures, NAICS 311351, 311352
http://factfinder.census.gov/bkmk/table/1.0/en/ASM/2014/31GS101//naics~311351|311352
17,815
The number of people employed by U.S. manufacturing establishments that produced nonchocolate confectionary products. This industry’s value of shipments totaled $8.2 billion in 2014.
Sources: U.S. Census Bureau, 2014 Annual Survey of Manufactures, NAICS 311340
http://factfinder.census.gov/bkmk/table/1.0/en/ASM/2014/31GS101//naics~311340
3,217
The number of U.S. confectionary and nut stores that sell candy and other confectionary products, employing 22,086 people in 2014.
Source: U.S. Census Bureau, 2014 County Business Patterns, NAICS 445292
http://factfinder.census.gov/bkmk/table/1.0/en/BP/2014/00A1//naics~445292
Dressed to Thrill
A sampling of occupations that one may dress up as for Halloween:
|
Occupation |
Number of Full-Time, Year-Round Employees |
|
Athletes, coaches, umpires and related workers |
109,943 |
|
Bailiffs, correctional officers and jailers |
376,460 |
|
Dentists |
95,713 |
|
Farmers, ranchers and other agricultural managers |
478,065 |
|
Firefighters |
254,678 |
|
Police and sheriff’s patrol officers |
662,619 |
|
Registered nurses |
2,227,835 |
Source: U.S. Census Bureau, 2015 American Community Survey, B24124
http://factfinder.census.gov/bkmk/table/1.0/en/ACS/15_1YR/B24124
Places to Spend Halloween
Some places around the country that may put you in the Halloween mood:
Tombstone, Ariz. (estimated population 1,312)
Source: U.S. Census Bureau, 2015 Population Estimates
http://factfinder.census.gov/bkmk/table/1.0/en/PEP/2015/PEPANNRES/1620000US0474400
Sleepy Hollow, N.Y. (estimated population 10,242)
Source: U.S. Census Bureau, 2015 Population Estimates
http://factfinder.census.gov/bkmk/table/1.0/en/PEP/2015/PEPANNRES/1620000US3667638
Kill Devil Hills, N.C. (estimated population 7,058)
Source: U.S. Census Bureau, 2015 Population Estimates
http://factfinder.census.gov/bkmk/table/1.0/en/PEP/2015/PEPANNRES/1620000US3735720
Yellville, Ark. (estimated population 1,169)
Source: U.S. Census Bureau, 2015 Population Estimates
http://factfinder.census.gov/bkmk/table/1.0/en/PEP/2015/PEPANNRES/1620000US0577330
Transylvania County, N.C. (estimated population 33,211)|
Source: U.S. Census Bureau, 2015 Population Estimates http://factfinder.census.gov/bkmk/table/1.0/en/PEP/2015/PEPANNRES/0500000US37175
Slaughter Beach, Del. (estimated population 230)
Source: U.S. Census Bureau, 2015 Population Estimates
http://factfinder.census.gov/bkmk/table/1.0/en/PEP/2015/PEPANNRES/1620000US1067050
Casper, Wyo. (estimated population 60,285)
Source: U.S. Census Bureau, 2015 Population Estimates
http://factfinder.census.gov/bkmk/table/1.0/en/PEP/2015/PEPANNRES/1620000US5613150
Scarville, Iowa (estimated population 71)
Source: U.S. Census Bureau, 2015 Population Estimates
http://factfinder.census.gov/bkmk/table/1.0/en/PEP/2015/PEPANNRES/1620000US1971040
Truth or Consequences, N.M. (estimated population 6,079)
Source: U.S. Census Bureau, 2015 Population Estimates
http://factfinder.census.gov/bkmk/table/1.0/en/PEP/2015/PEPANNRES/1620000US3579840
Spooktacular
4,449
The number of motion picture theaters (except drive-ins) in the U.S. in 2014 where one could possibly enjoy a horror movie. California (511), Texas (326), New York (265) and Florida (195) had the most of such establishments. There were 219 drive-in motion picture theaters in 2014 — Ohio had 23, and California and Pennsylvania each had 19 drive-in motion picture theaters.
Source: U.S. Census Bureau, 2014 County Business Patterns, NAICS 512131 & 512132
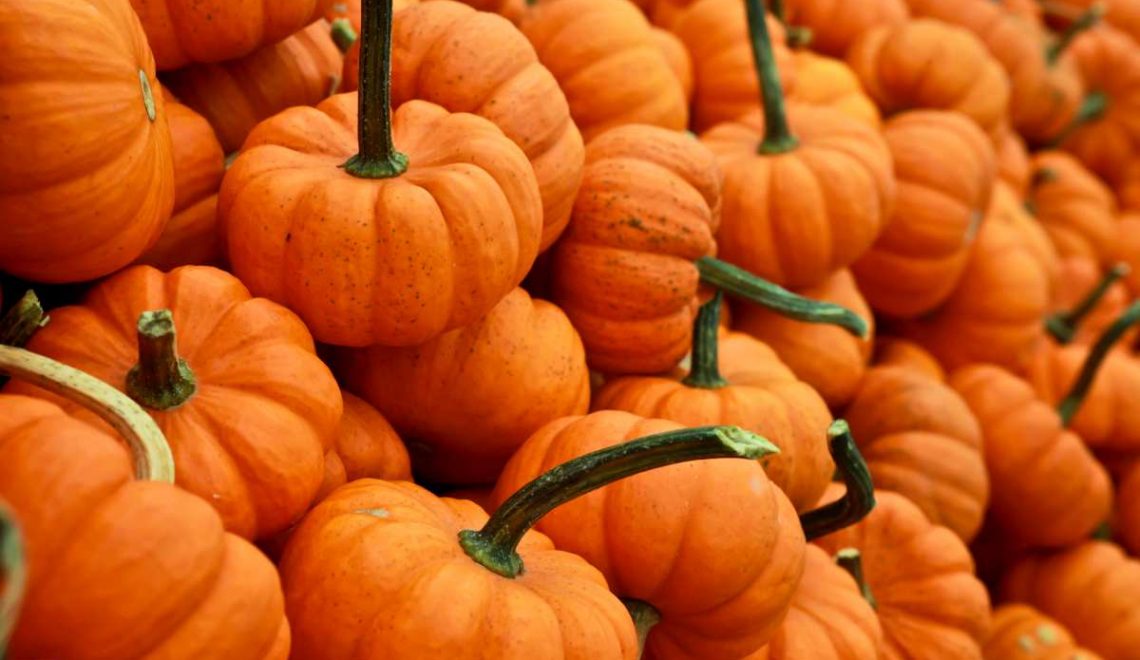
40,900
The number of acres of pumpkins harvested in the U.S. in 2015, with a total estimated production value of $90.2 million. Of the top six pumpkin-producing states, Illinois led the country by producing an estimated 318.0 million pounds of this vined gourd, followed by California, Ohio, Pennsylvania, Michigan and New York. Pumpkins are frequently carved as decorations around Halloween.
Source: U.S. Department of Agriculture, National Agricultural Statistics Service, Page 8
http://usda.mannlib.cornell.edu/usda/current/VegeSumm/VegeSumm-02-04-2016.pdf
$1.04 Billion
The estimated construction spending on theme/amusement parks in 2015. Halloween events at theme/amusement parks can be frighteningly fun. For more information about construction spending, visit <www.census.gov/constructionspending>.
Source: U.S. Census Bureau, Value of Construction Put in Place Survey
www.census.gov/construction/c30/xls/private.xls
1,078
The number of formal wear and costume rental establishments in the U.S. This industry had 6,611 paid employees across the nation in 2014 (for the pay period including March 12, 2014).
Source: U.S. Census Bureau, 2014 County Business Patterns, NAICS 532220
http://factfinder.census.gov/bkmk/table/1.0/en/BP/2014/00A1/0100000US|0100000US.04000/naics~532220
302
The number of broom, brush, and mop and casket manufacturing establishments (for the more authentic witches and vampires). Combined, these two industries employed 12,627 people and had a total value of shipments of $3.6 billion in 2012.
Source: U.S. Census Bureau, 2012 Economic Census, NAICS 339994 and NAICS 339995
http://factfinder.census.gov/bkmk/table/1.0/en/ECN/2012_US/31SG1//naics~339994|339995
$1.03 billion
Dollar value of U.S. fresh apples exported in 2015. Whether bobbing for or dipping in caramel, apples can be a fun treat around Halloween.
Source: U.S. Census Bureau, International Trade Statistics, Commodity Code 080810
Who You Gonna Call?
89.0%
The percentage of households that had a cellular phone in 2011, compared with only 36.0 percent in 1998. The percentage of households with a cellular phone only (no landline) rose from less than 1.0 percent in 1998 to 28.0 percent in 2011.
Source: U.S. Census Bureau, Extended Measures of Well-Being: Living Conditions in the United States, 2011
www.census.gov/prod/2013pubs/p70-136.pdf
Following is a list of observances typically covered by the Census Bureau’s Facts for Features series:
|
African-American History Month (February) |
Labor Day (1st Monday in September) |
|
Super Bowl (1st Sunday in February) |
Grandparents Day (1st Sunday after Labor Day) |
|
Valentine’s Day (Feb. 14) |
Hispanic Heritage Month (Sept. 15-Oct. 15) |
|
Women’s History Month (March) |
Unmarried and Single Americans Week (3rd week of September) |
|
Irish-American Heritage Month (March)/ |
Halloween (Oct. 31) |
|
St. Patrick’s Day (March 17) |
American Indian/Alaska Native Heritage Month |
|
Earth Day (April 22) |
(November) |
|
Asian/Pacific American Heritage Month (May) |
Veterans Day (Nov. 11) |
|
Older Americans Month (May) |
Thanksgiving Day (4th Thursday in November) |
|
Mother’s Day (2nd Sunday in May) |
The Holiday Season (December) |
|
Hurricane Season Begins (June 1) |
|
|
Father’s Day (3rd Sunday in June) |
|
|
The Fourth of July (July 4) |
|
|
Anniversary of Americans with Disabilities Act (July 26) |
|
|
Back to School (August) |
|
Editor’s note: The preceding data were collected from a variety of sources and may be subject to sampling variability and other sources of error. Facts for Features are customarily released about two months before an observance in order to accommodate magazine production timelines. Questions or comments should be directed to the Census Bureau’s Public Information Office.
Bildquelle
- food-healthy-fruit-67510-klein: Bildrechte beim Autor